Filters and Sort
Beds & Baths
Bedrooms
Baths
- epIQ Grade
- A's and above
- B's and above
- C's and above
- D's and above
Sort by:
- Default
- Rent (low to high)
- Rent (high to low)
- Overall Rating
- Sort by epIQ
- # of reviews
- Most Photos
- Move-In Specials
- Video
- 3D Tour
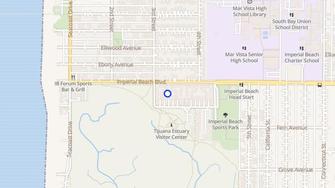
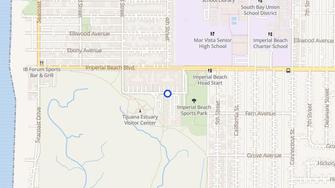
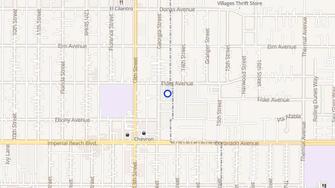
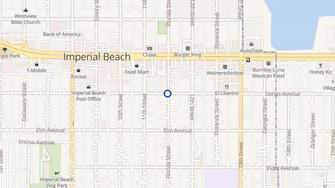
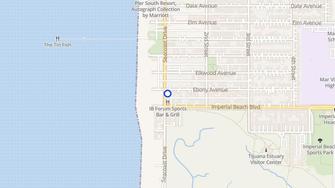
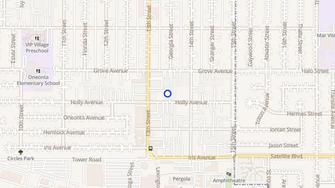
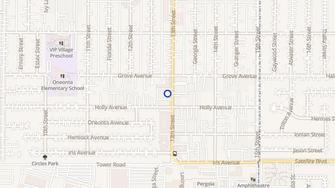
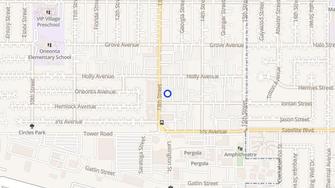
18 Apartments Near Me in Imperial Beach, CA
 ""...
""... 


Cost of Living
68% Rent
vs
32% Own
Renter's Cost vs. Income
Last Updated October 2023
Average Monthly Rent (Census)
Last Updated October 2023
The breakdown of people who rent in Imperial Beach, CA is 68% renters and 32% owners. The monthly average cost of rent in Imperial Beach is $1,683 per month and the yearly average income is $84,153 per year. This compares to an average rent of $1,641 in CA and $1,003 in the US. This data was last updated in October 2023
Travel and Transport
Commuting to Work
Last Updated October 2023
Residents of Imperial Beach, CA spend an average of 28.0 minutes commuting to work. 31% have short commutes under 20 minutes, 59% travel between 20 and 60 minutes, and 10% face longer journeys exceeding an hour, reflecting varying levels of accessibility and distance.
In Imperial Beach, CA, 5% of residents rely on public transportation, 3% commute on foot, 1% use bicycles, and 92% opt for other modes such as cars and ride-sharing.
FAQs
What is the average rating of a community in Imperial Beach?
The average rating is 2/5 stars.
What is the average monthly rent for Imperial Beach?
Based on 2023 city data, the average monthly rent is $1,683.00.
What is the average commute time?
Based on 2017 city data, the average commute is 28 mins.